import mathimport numpy as npimport matplotlib.pyplot as plt%matplotlib inline
# Now define a function, a scaler value function f(x)def f(x): return 3*x**2 - 4*x +5
# Now we can just pass in some value to checkf(3.0)
Output
20.0
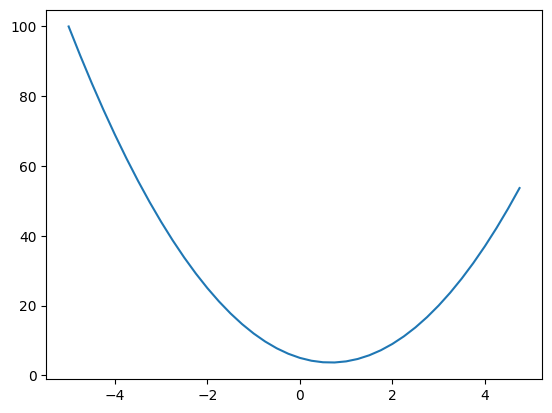
# The f(x) equation as you can see is a Quadratic equation, precisely a Parabola# So now, we try to plot it# Now, we'll just add like a range of values to feed in# We'll start with x-axis values so, from -5 to 5 (Not including 5) in the steps of 0.25# Therefore creating a numpy arrayxs = np.arange(-5,5,0.25)xs
# Now for the y-axis values, we call each of those elements in the numpy array to the function f(x)# Therefore we create an another numpy array which containes the values after applying the function to each of the elements in xsys = f(xs)ys
# And now we plot this using matplotlibplt.plot(xs, ys)
Output
[<matplotlib.lines.Line2D at 0x2274508baf0>]
Now we need to see what is the derivative of this function f(x) at any single input point x
So what is the derivative at different point in the x-axis to the function f(x)
Now, we can check the derivative of the value by considering a very small value of h (almost close to zero)
h = 0.001x = 3.0
# Now, if we take the f(x) value directly, we know we get 20.0 (Already done in above cells)# Lets say what if we add the value of h to it, so we are nudging it to a slighly more positive direction# So the value must be slightly more than 20f(x+h)
Output
20.014003000000002
# Now, by how much that above value has increased shows us the strength or the size of that slope# Therefore, Next we see how much the function has respondedf(x+h) - f(x)
Output
0.01400300000000243
# Next we have to normalise it by adding the value rise of the run i.e. h, to get the value of the slope(f(x+h) - f(x))/h
Output
14.00300000000243
Therefore, at 3 i.e. when x=3, the slope is 14.
You can see the same value if you calculate it manually using the derivative formula:
=> Derivative of 3x^2 - 4x +5
=> 6x-4
=> 6(3) - 4
=> 18 -4
=> 14
# Now what if we add a negative value for x?# Then even the function will become negative. Therefore, we will be getting a negative sign slopeh = 0.00000001 # Cant make this too small, as unlike in theory, computer can handle only a finite amount. Therefore make it too small and it will directly return 0 :)x = -3.0(f(x+h) - f(x))/h
Output
-22.00000039920269
# Now at some point the slop must be 0, therefore nudging a small value either way from that point, it still remains 0# In this case, for the function it is at around x = 2/3h = 0.00000001x = 2/3(f(x+h) - f(x))/h