Note: Start from 3-value-object.ipynb and then come back to this notebook
class Value:

    def __init__(self, data, _children=(), _op=''):
        self.data = data
        self._prev = set(_children)
        self._op = _op

    def __repr__(self):   # This basically allows us to print nicer looking expressions for the final output
        return f"Value(data={self.data})"

    def __add__(self, other):
        out = Value(self.data + other.data, (self, other), '+')
        return out

    def __mul__(self, other):
        out = Value(self.data * other.data, (self, other), '*')
        return out
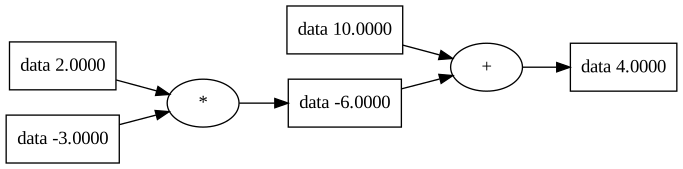
a = Value(2.0)b = Value(-3.0)c = Value(10.0)d= a*b + cd
Output
Value(data=4.0)
from graphviz import Digraphdef trace(root): #Builds a set of all nodes and edges in a graph nodes, edges = set(), set() def build(v): if v not in nodes: nodes.add(v) for child in v._prev: edges.add((child, v)) build(child) build(root) return nodes, edgesdef draw_dot(root): dot = Digraph(format='svg', graph_attr={'rankdir': 'LR'}) #LR == Left to Right nodes, edges = trace(root) for n in nodes: uid = str(id(n)) #For any value in the graph, create a rectangular ('record') node for it dot.node(name = uid, label = "{ data %.4f }" % ( n.data, ), shape='record') if n._op: #If this value is a result of some operation, then create an op node for it dot.node(name = uid + n._op, label=n._op) #and connect this node to it dot.edge(uid + n._op, uid) for n1, n2 in edges: #Connect n1 to the node of n2 dot.edge(str(id(n1)), str(id(n2)) + n2._op) return dot
draw_dot(d)
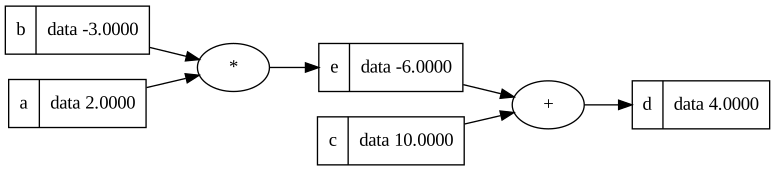
Same graph, but we are just adding labels
class Value:

    def __init__(self, data, _children=(), _op='', label=''):
        self.data = data
        self._prev = set(_children)
        self._op = _op
        self.label = label

    def __repr__(self):   # This basically allows us to print nicer looking expressions for the final output
        return f"Value(data={self.data})"

    def __add__(self, other):
        out = Value(self.data + other.data, (self, other), '+')
        return out

    def __mul__(self, other):
        out = Value(self.data * other.data, (self, other), '*')
        return out
a = Value(2.0, label='a')b = Value(-3.0, label='b')c = Value(10.0, label='c')e = a*b; e.label='e'd= e + c; d.label='d'd
Output
Value(data=4.0)
from graphviz import Digraphdef trace(root): #Builds a set of all nodes and edges in a graph nodes, edges = set(), set() def build(v): if v not in nodes: nodes.add(v) for child in v._prev: edges.add((child, v)) build(child) build(root) return nodes, edgesdef draw_dot(root): dot = Digraph(format='svg', graph_attr={'rankdir': 'LR'}) #LR == Left to Right nodes, edges = trace(root) for n in nodes: uid = str(id(n)) #For any value in the graph, create a rectangular ('record') node for it dot.node(name = uid, label = "{ %s | data %.4f }" % ( n.label, n.data), shape='record') if n._op: #If this value is a result of some operation, then create an op node for it dot.node(name = uid + n._op, label=n._op) #and connect this node to it dot.edge(uid + n._op, uid) for n1, n2 in edges: #Connect n1 to the node of n2 dot.edge(str(id(n1)), str(id(n2)) + n2._op) return dot
from graphviz import Digraphdef trace(root): #Builds a set of all nodes and edges in a graph nodes, edges = set(), set() def build(v): if v not in nodes: nodes.add(v) for child in v._prev: edges.add((child, v)) build(child) build(root) return nodes, edgesdef draw_dot(root): dot = Digraph(format='svg', graph_attr={'rankdir': 'LR'}) #LR == Left to Right nodes, edges = trace(root) for n in nodes: uid = str(id(n)) #For any value in the graph, create a rectangular ('record') node for it dot.node(name = uid, label = "{ %s | data %.4f }" % ( n.label, n.data), shape='record') if n._op: #If this value is a result of some operation, then create an op node for it dot.node(name = uid + n._op, label=n._op) #and connect this node to it dot.edge(uid + n._op, uid) for n1, n2 in edges: #Connect n1 to the node of n2 dot.edge(str(id(n1)), str(id(n2)) + n2._op) return dot